
[fusion_builder_container hundred_percent=”no” equal_height_columns=”no” menu_anchor=”” hide_on_mobile=”small-visibility,medium-visibility,large-visibility” class=”” id=”” background_color=”” background_image=”” background_position=”center center” background_repeat=”no-repeat” fade=”no” background_parallax=”none” parallax_speed=”0.3″ video_mp4=”” video_webm=”” video_ogv=”” video_url=”” video_aspect_ratio=”16:9″ video_loop=”yes” video_mute=”yes” overlay_color=”” video_preview_image=”” border_size=”” border_color=”” border_style=”solid” padding_top=”” padding_bottom=”” padding_left=”” padding_right=””][fusion_builder_row][fusion_builder_column type=”1_1″ layout=”1_1″ background_position=”left top” background_color=”” border_size=”” border_color=”” border_style=”solid” border_position=”all” spacing=”yes” background_image=”” background_repeat=”no-repeat” padding_top=”” padding_right=”” padding_bottom=”” padding_left=”” margin_top=”0px” margin_bottom=”0px” class=”” id=”” animation_type=”” animation_speed=”0.3″ animation_direction=”left” hide_on_mobile=”small-visibility,medium-visibility,large-visibility” center_content=”no” last=”no” min_height=”” hover_type=”none” link=””][fusion_text]
Wind Load Calculation
Wind Load Calculation is an overview of the force that blowing wind exerts on a tall object. A number of factors that influence the actual wind load on a real building, include the surrounding terrain, nearby structures, trees, and typical weather patterns for the area. Comparing wind load calculations are most complicated . Calculations try to account for as many of these external factors as possible, to the point where the wind load section in American Society for Civil Engineer’s ASCE 7 standard, spans five chapters and over 100 pages.
[/fusion_text][/fusion_builder_column][/fusion_builder_row][/fusion_builder_container][fusion_builder_container hundred_percent=”yes” overflow=”visible”][fusion_builder_row][fusion_builder_column type=”1_1″ layout=”1_1″ background_position=”left top” background_color=”” border_size=”” border_color=”” border_style=”solid” spacing=”yes” background_image=”” background_repeat=”no-repeat” padding_top=”” padding_right=”” padding_bottom=”” padding_left=”” margin_top=”0px” margin_bottom=”0px” class=”” id=”” animation_type=”” animation_speed=”0.3″ animation_direction=”left” hide_on_mobile=”no” center_content=”no” min_height=”none” last=”no” hover_type=”none” link=”” border_position=”all”][fusion_text]

ASCE 7’s Applications
Comparing one of ASCE 7’s Applications with the two equations included in the last blog. First was a generic drag force calculation, second was incorporating two other coefficients to account for exposure and the intensity of wind gusts. As an example, the use three objects on top of a 100-foot tall building:
- A 10’ tall, 10’ wide cylinder.
- A cube with the same volume as cylinder A, oriented with a face normal (90°) to the wind direction.
- Another cube with the same volume, but rotated 45° for a slightly more aerodynamic front.
For the wind speed, I chose 110 mph. This may seem high, but is the standard design wind speed for buildings in California as set in ASCE 7. Representing the speed of 3-second intense wind gusts that structures must be designed to withstand.
Wind Load Equations
Numerous methods are used for calculating wind load on a structure or object. ASCE 7 is one of the most detailed, other organizations like the International Code Council and the National Association of Tower Erectors have adapted the equations from ASCE 7 or developed their own, based on their industry’s specific needs. For this brief examination I will use the generic drag calculation (Eqn 1-2), a drag calculation modified with two additional wind-related coefficients (Eqn 3-5), and ASCE 7’s equation for “other structures” (chimneys, tanks, rooftop equipment and similar structures) (Eqn 6-7).
| (1) (2) |
Where:
F = wind load (in N or lbf)
P = wind pressure (in Pa or psf)
A = projected area (in m2 or ft2)
Cd = drag coefficient (unitless)
V = wind speed
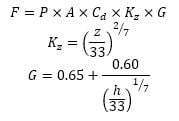 | (3) (4) (5) |
Where:
Kz = exposure coefficient
G = gust response factor
z = height of the midpoint of the object above the ground
h = height of the top of the object above the ground
| (6) (7) |
Where:
qz = velocity pressure
G = gust effect factor (as defined in ASCE 7 §26.9)
Cf = force coefficient (as defined in ASCE 7 §29.5)
Kz = velocity pressure coefficient (as defined in ASCE 7 §29.3.1)
Kzt = topographic factor (as defined in ASCE 7 §26.8.2)
Kd = wind directionality factor (as defined in ASCE 7 §26.5)
Wind Load Factors
[/fusion_text][/fusion_builder_column][fusion_builder_column type=”1_1″ layout=”1_1″ background_position=”left top” background_color=”” border_size=”” border_color=”” border_style=”solid” spacing=”yes” background_image=”” background_repeat=”no-repeat” padding_top=”” padding_right=”” padding_bottom=”” padding_left=”” margin_top=”0px” margin_bottom=”0px” class=”” id=”” animation_type=”” animation_speed=”0.3″ animation_direction=”left” hide_on_mobile=”no” center_content=”no” min_height=”none” last=”no” hover_type=”none” link=”” border_position=”all”][fusion_text]
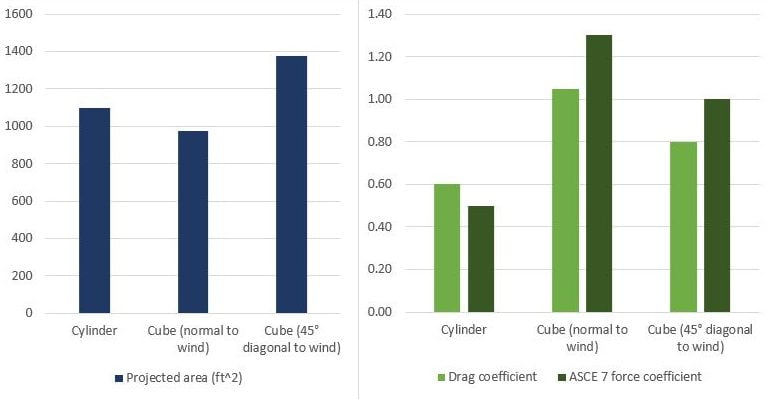
For this test, I elected to keep the volume the same for the three structures. If this were a test were part of the design process for actual rooftop objects, like tanks or equipment enclosures, then the designer would likely need to enclose a given volume but could optimize the enclosure around that volume. The upshot is that although all three have the same volume, they present different cross sections to the wind. This is illustrated on the left side of Figure 2.
The right side of Figure 2 shows the coefficient of drag and the analogous “force coefficient” provided in ASCE 7. For both values, the cylinder comes in below 1, while the cube has a value at or above 1. As one might imagine, the cylinder experiences less drag, due to the smoother airflow created around it. The diagonal cube still streamlines the airflow around it to a small extent, but the normal cube experiences a significant amount of drag. With coefficients above one, the normal cube will experience a higher load than the other shapes.
Wind Load Calculation Results
[/fusion_text][/fusion_builder_column][fusion_builder_column type=”1_1″ layout=”1_1″ background_position=”left top” background_color=”” border_size=”” border_color=”” border_style=”solid” spacing=”yes” background_image=”” background_repeat=”no-repeat” padding_top=”” padding_right=”” padding_bottom=”” padding_left=”” margin_top=”0px” margin_bottom=”0px” class=”” id=”” animation_type=”” animation_speed=”0.3″ animation_direction=”left” hide_on_mobile=”no” center_content=”no” min_height=”none” last=”no” hover_type=”none” link=”” border_position=”all”][fusion_text]

Figure 3 shows the wind load (in pounds) for each shape, using the three calculation methods. As we expected, the cylinder’s low drag (or ASCE 7 force) coefficients give it a much lower wind load than the cubes of equal volume. Interestingly, the diagonal cube has a higher wind load than the cube with normal wind, even with its lower drag coefficients. The diagonal cube’s larger projected area overcame its aerodynamic advantage over the normal cube.
Both of the more complex wind load equations resulted in higher wind loads than the simple drag calculation, especially for the cube. This is partly due to the added consideration of other factors like terrain and turbulence. These equations are also intended to be “design” equations, so their additional coefficients also serve as a built-in safety factor. By designing wind load equations that result in higher wind loads, the creators of these standards can ensure that the buildings and structures designed by civil and mechanical engineers can more than withstand any wind force they might experience in their lifetime.
Accuracy and Safety Factor
Since the results for each of these three calculation methods can differ substantially, one might wonder where the actual wind load would be located on Figure 3. We can test this ourselves to some extent by simulating the three test objects in a computational fluid dynamics (CFD) program. For the next blog post, I will explain the process of creating an accurate CFD model, and will show the resulting airflow around and pressure on the cylinder and cubes.
Resources
- International Code Council. (2014). 2015 International Building Code. Country Club Hills, IL: ICC.
- Telecommunications Industry Association. (2011). 2012 TIA-222-G Structural Standard for Antenna Supporting Structures and Antennas. Arlington, VA.
- American Society of Civil Engineers. (2010). ASCE 7 Minimum Design Loads for Buildings and Other Structures. Reston, Va.
[/fusion_text][/fusion_builder_column][/fusion_builder_row][/fusion_builder_container]